Winning the 50:50 game
Shifting the odds in your favour
The 50:50 game represents the brutal mathematics of brand performance. On average, any given brand has precisely a 50% chance of growth and a 50% chance of decline. This isn't speculation, or opinion; it's what 13 years of Brand Footprint data reveals about the reality of the modern FMCG market.
But here's the crucial insight: while the overall odds remain stubbornly fixed, brands can systematically shift these probabilities in their favour. The question isn't whether you can escape the 50:50 game, but how you can consistently win it.
That’s why the theme of this year's Brand Footprint report is 'winning the 50:50 game', examining what sets the winners apart in this high-stakes competition.
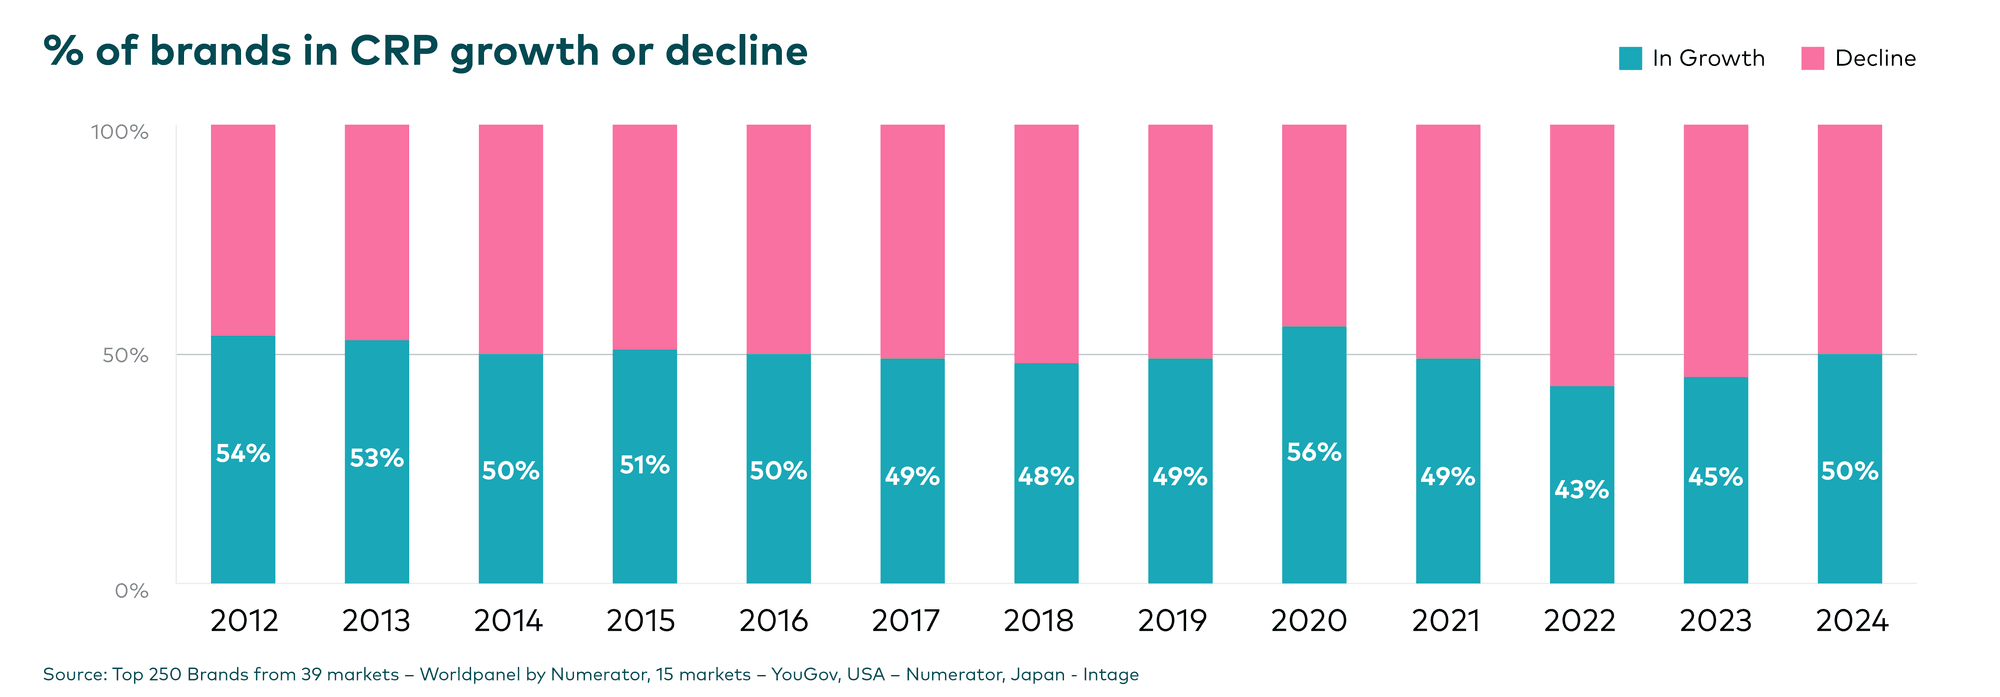
Across 13 editions of Brand Footprint, we've watched this 50:50 split play out with remarkable consistency. The proportion of brands in growth versus those in decline has remained within a narrow 45-55% window, with only two notable exceptions.
In 2020, lockdowns triggered one of the biggest behavioural shifts we've seen in FMCG, forcing out-of-home consumption into the home and lifting 56% of brands into growth. Then, just two years later, the highest inflation levels in over a decade created the opposite effect, with only 43% of brands managing to increase their Consumer Reach Points (CRPs).
The 2024 results offer an almost perfect illustration of this fundamental truth, with 50.2% of brands achieving growth. This represents a significant recovery from 2023's inflation-dampened 45%, but confirms that even in improved conditions the basic 50:50 dynamic reasserts itself.
Understanding this baseline is crucial for strategic planning. It means that without deliberate intervention, your brand faces the same odds as a coin toss. The winners are those who understand how to improve these odds, which we will explore through some different lenses.
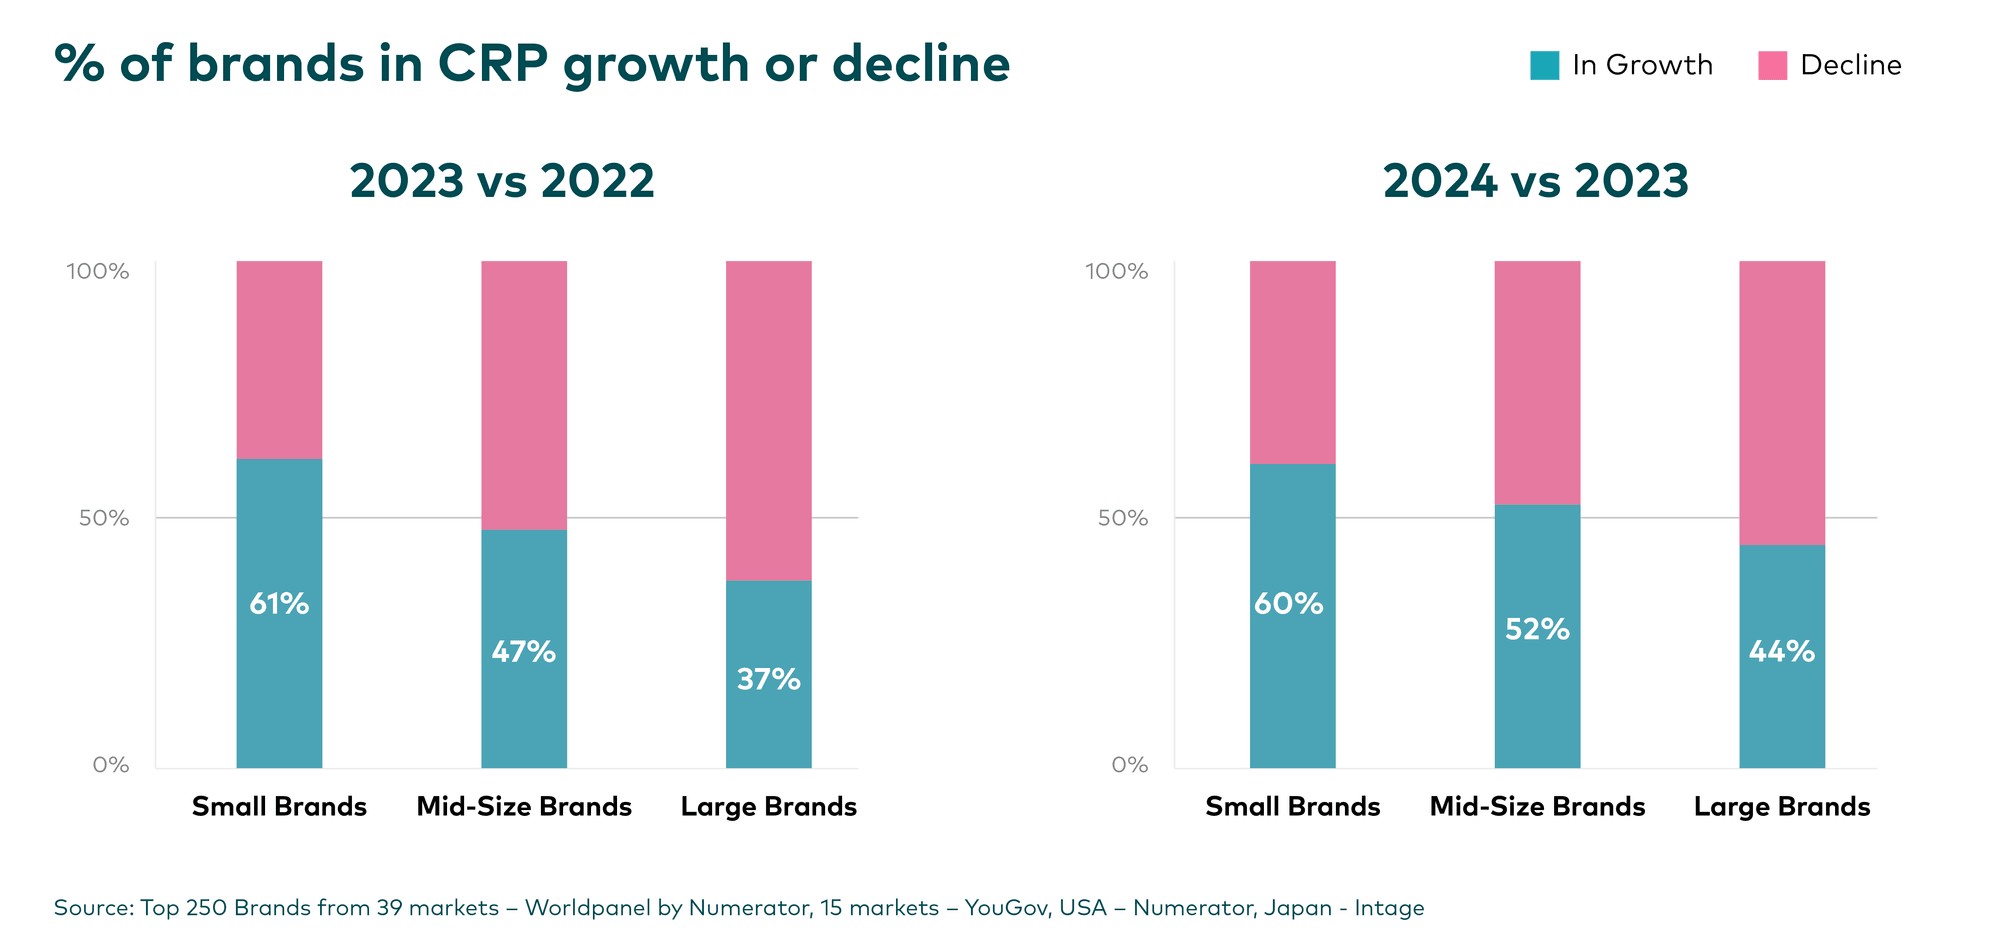
Our first lens examines how brand size influences growth probability. Using brand penetration as our metric, we define small brands as having 10% or less penetration, large brands as exceeding 30%, and mid-size brands as those in between.
Data from both 2023 and 2024 reveal a clear inverse relationship: the smaller the brand, the higher the likelihood of growth. This creates a strategic paradox. Every brand aspires to scale from small to large, yet our data shows that growth becomes progressively more difficult as brands expand.
This isn't an argument for remaining small, but rather a call for realistic planning.
As brands mature, they must invest disproportionately more resources to maintain the same growth rates. The mathematics are unforgiving: all brands lose shoppers year-on-year, and replacing these lost customers while adding new ones becomes exponentially harder as your base expands.
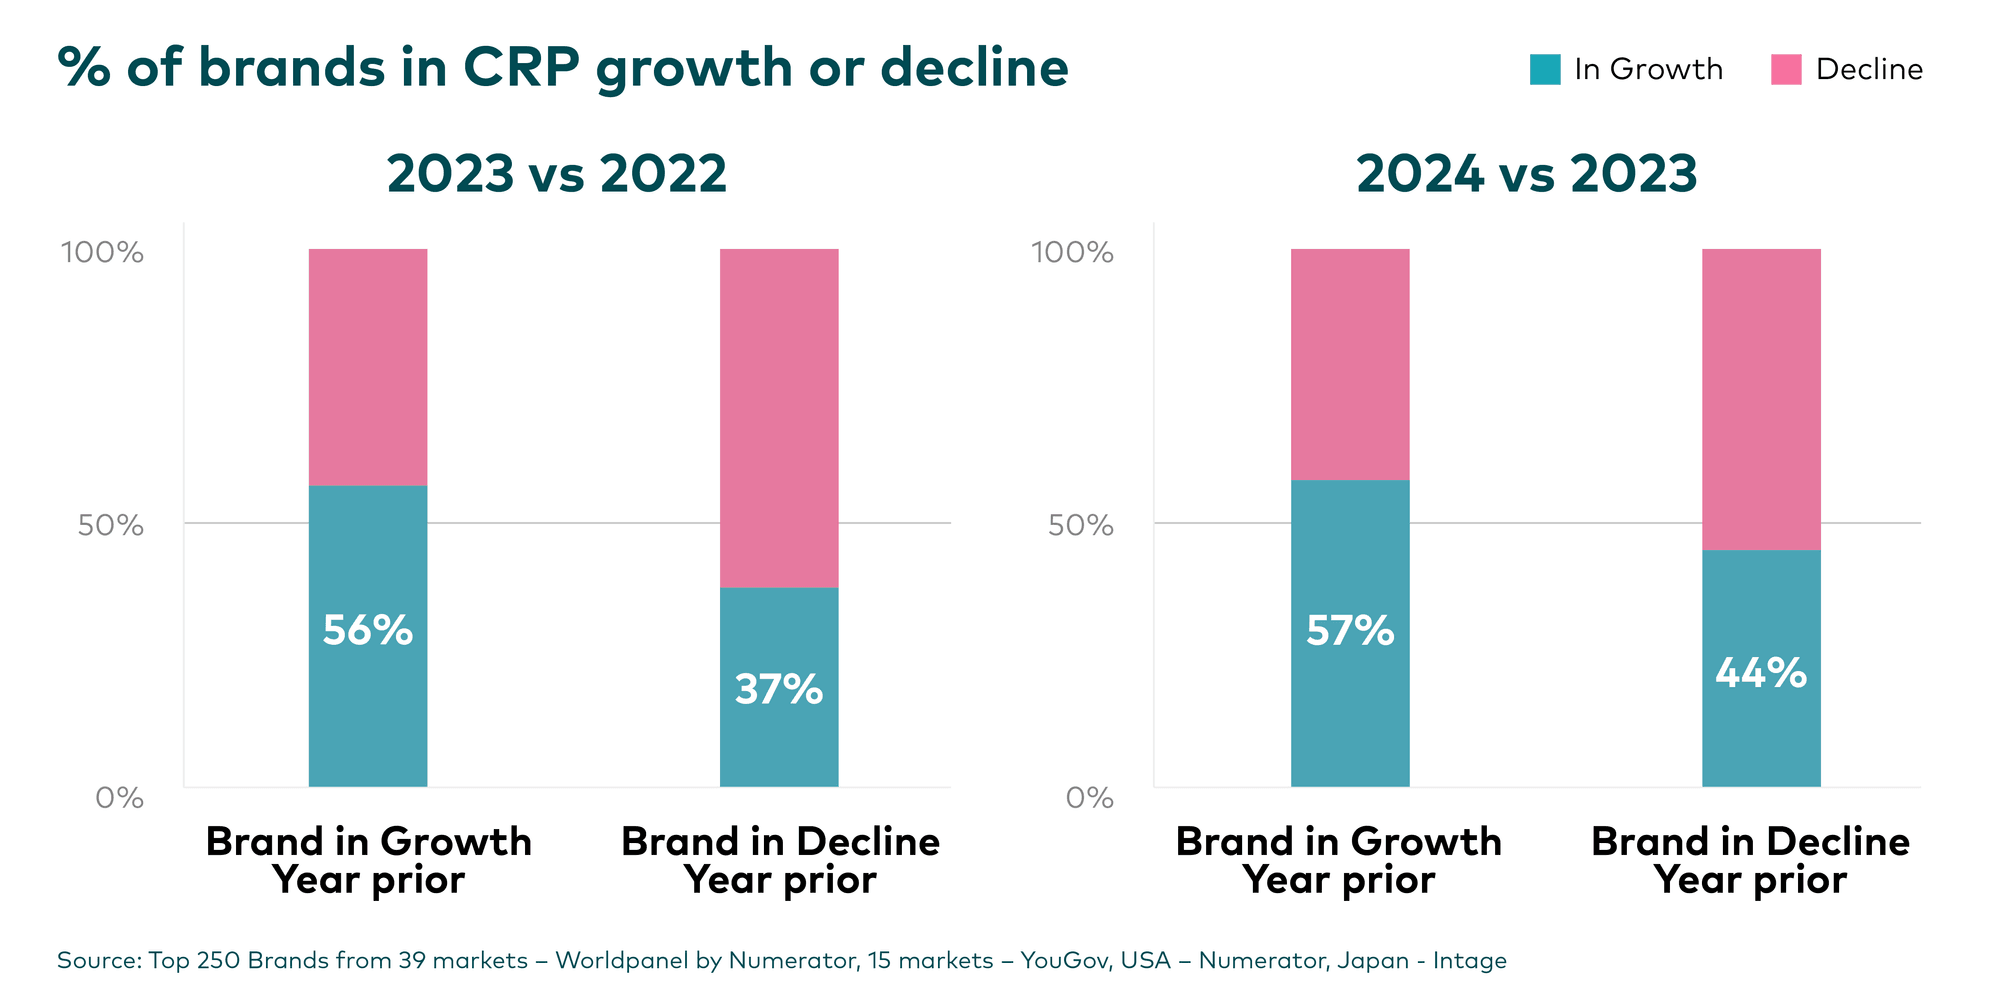
Success breeds success. Our analysis reveals that brands that are currently growing face significantly better odds of continued growth the following year.
In 2023 and 2024, 56% and 57% respectively of brands that had previously been in growth maintained their trajectory. Unfortunately, the inverse proves equally true: declining brands tend to remain in decline, creating a momentum trap that's difficult to escape.
This finding has profound implications for resource allocation.
Reversing decline requires substantially more investment than maintaining growth. Unless there's significant change in investment levels across marketing levers, declining brands will likely remain trapped in negative momentum.
For companies managing multiple brands, this suggests the need for a portfolio strategy: protect and accelerate existing winners while being realistic about the investment required to turn around declining assets.
The data suggests that defending strong positions may yield better returns than attempting to resurrect struggling brands.
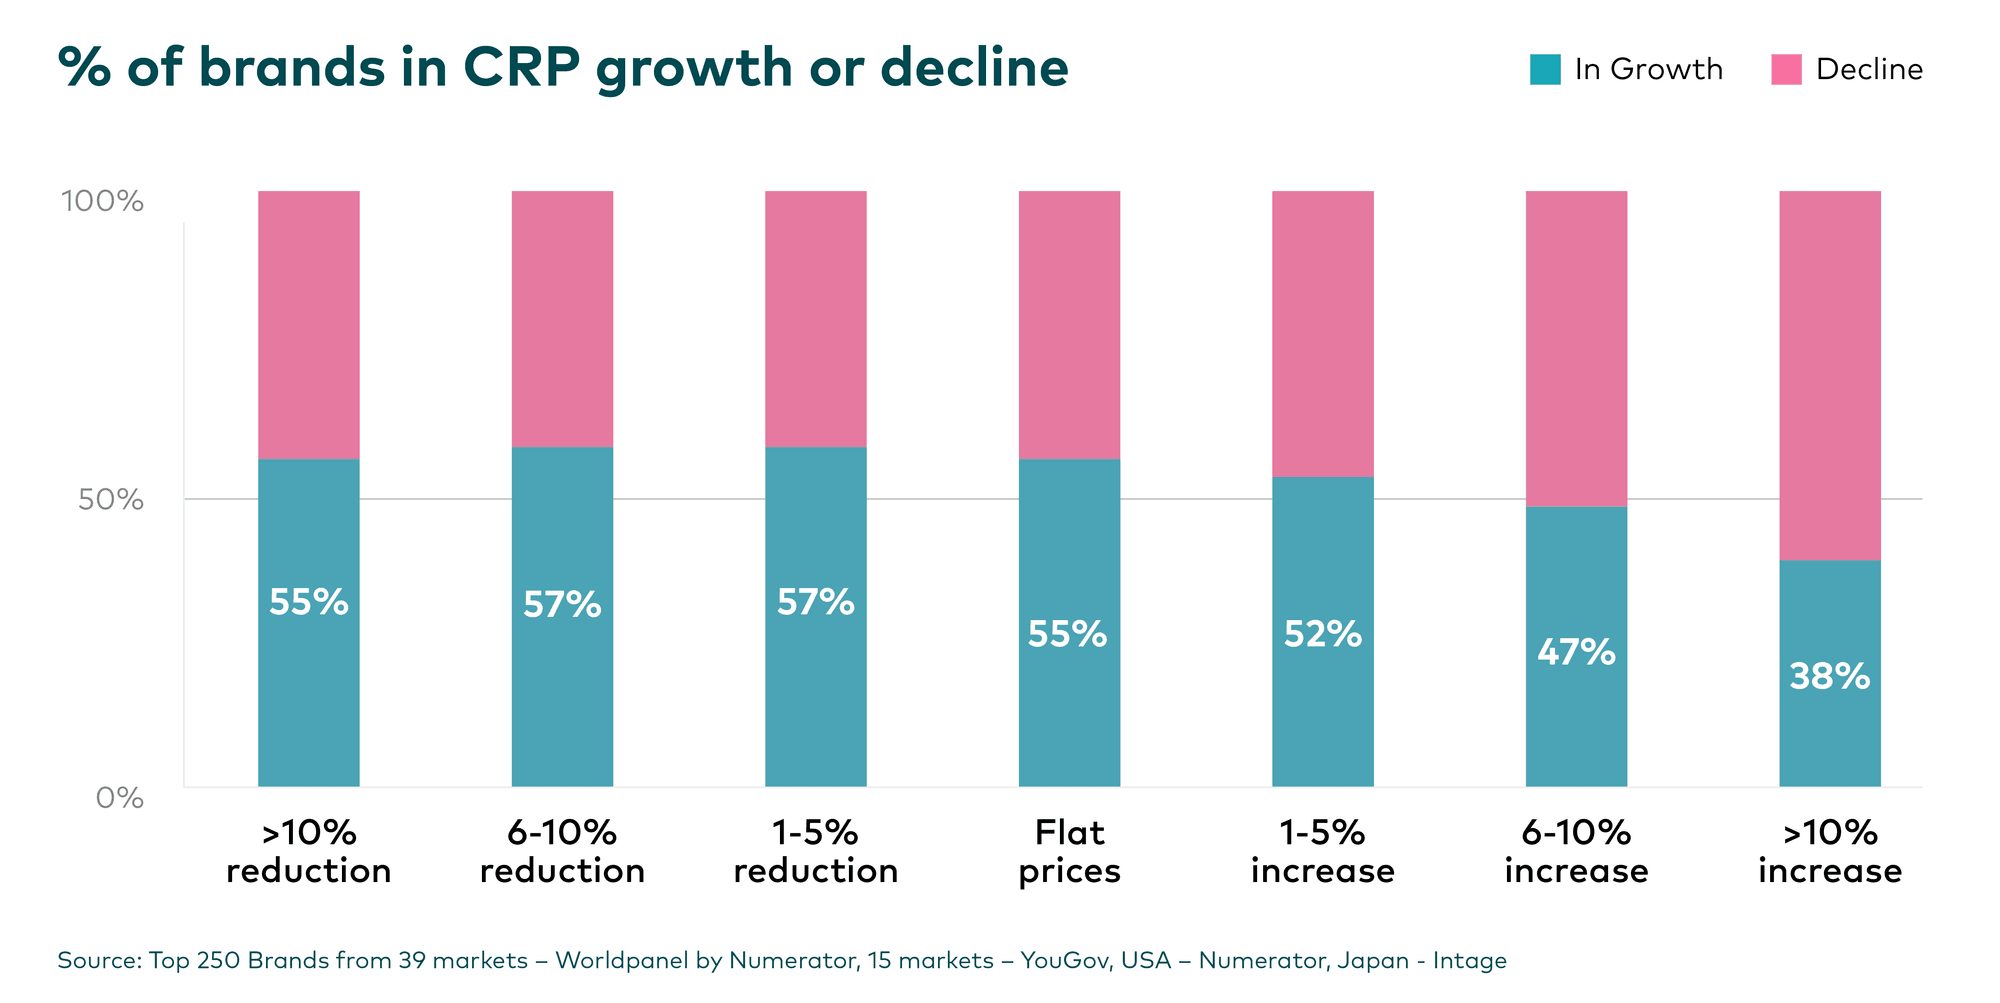
Unlike the previous factors, pricing represents a lever that brands can actively control. Our analysis of price increases and reductions reveals clear patterns in their impact on the likelihood of CRP growth.
Price reductions do shift growth odds favourably, but with diminishing returns. Interestingly, those brands in our ranking that reduced prices by over 10% saw slightly lower growth odds compared to those with more modest reductions.
On price increases, brands can safely raise prices by 1-5% without negatively impacting the likelihood of growth. However, increases of 6% or higher systematically reduce growth probability, which drops from 47% to 38% as increases become more aggressive.
Naturally, these thresholds must be contextualised within competitive and category dynamics. As a strategic rule of thumb, price increases exceeding 5% shift the 50:50 odds against you, potentially sacrificing growth for short-term margin gains.
With inflationary pressures potentially returning this year, brands may face difficult choices between maintaining affordability and preserving margins.
Geographic factors give rise to the most dramatic variations in the fundamental growth equation. Unlike brand size, momentum, or pricing, where patterns remain relatively stable, regional performance fluctuates drastically from year to year, driven by local FMCG trends that can completely reshape the competitive landscape.
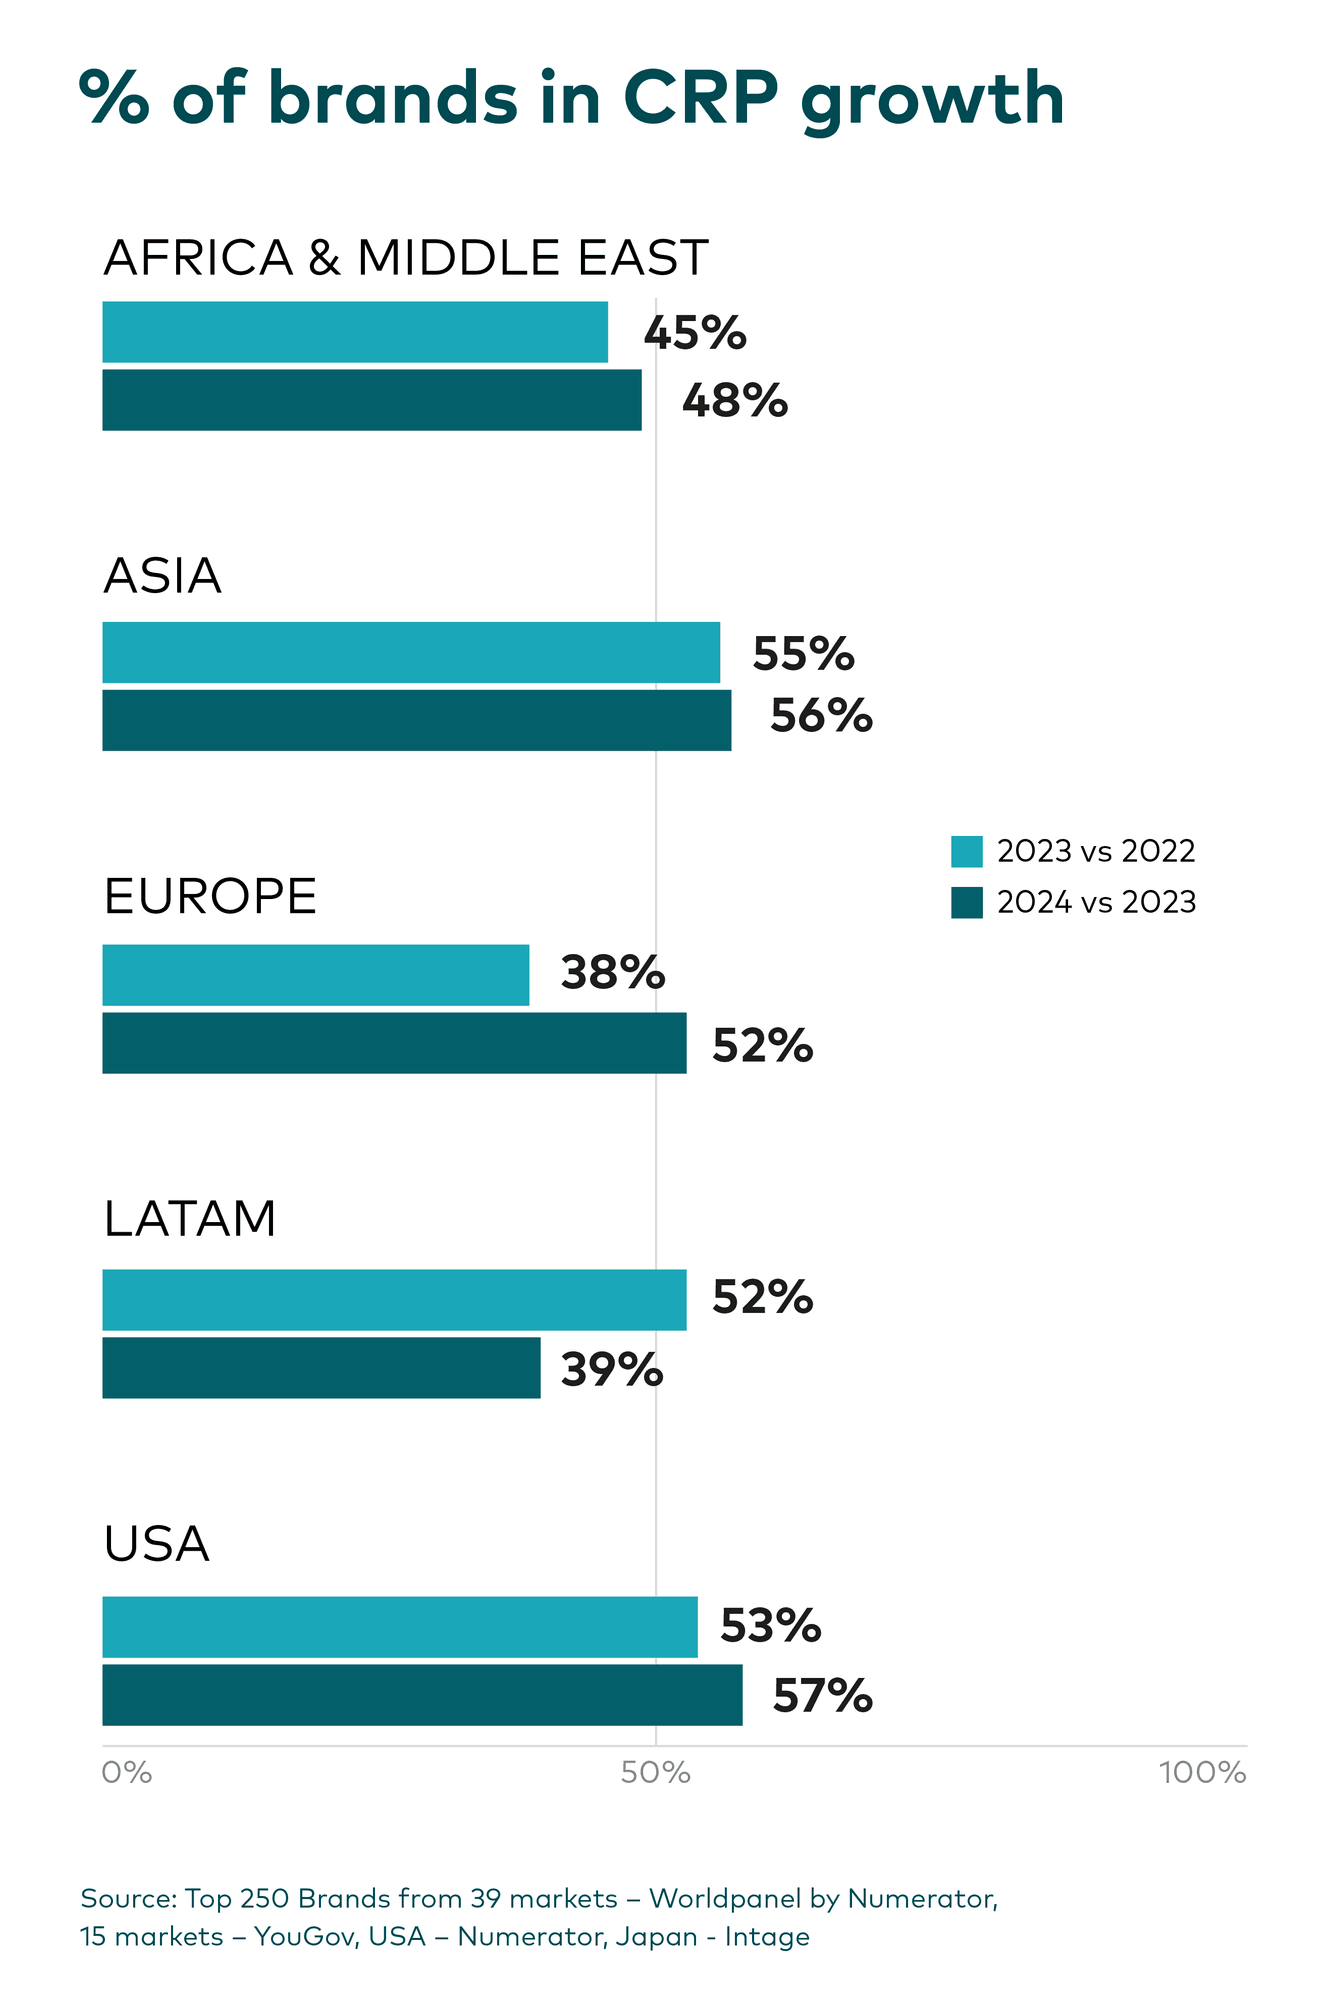
The US and Asia have emerged as consistent growth havens. In both 2023 and 2024, over 50% of brands in these regions achieved CRP growth. This stability creates significant strategic advantage.
Europe and Latin America tell a more volatile story. Brands in Europe faced severe headwinds in 2023, with only 38% achieving growth. However, 2024 brought a dramatic reversal, with the likelihood of growth jumping to 52%.
Latin America experienced the inverse: after a strong 52% growth rate in 2023, growth probability fell to just 39% in 2024.
This volatility has profound strategic implications. Brands need to understand their market's trajectory to calibrate growth expectations and resource requirements. A brand operating in a 39% growth environment needs fundamentally different investment levels to one operating where 52% of brands succeed.
The geography of growth reminds us that whilst the global 50:50 game remains constant, local markets can deviate substantially, creating both risks and opportunities for brands with regional or global portfolios.
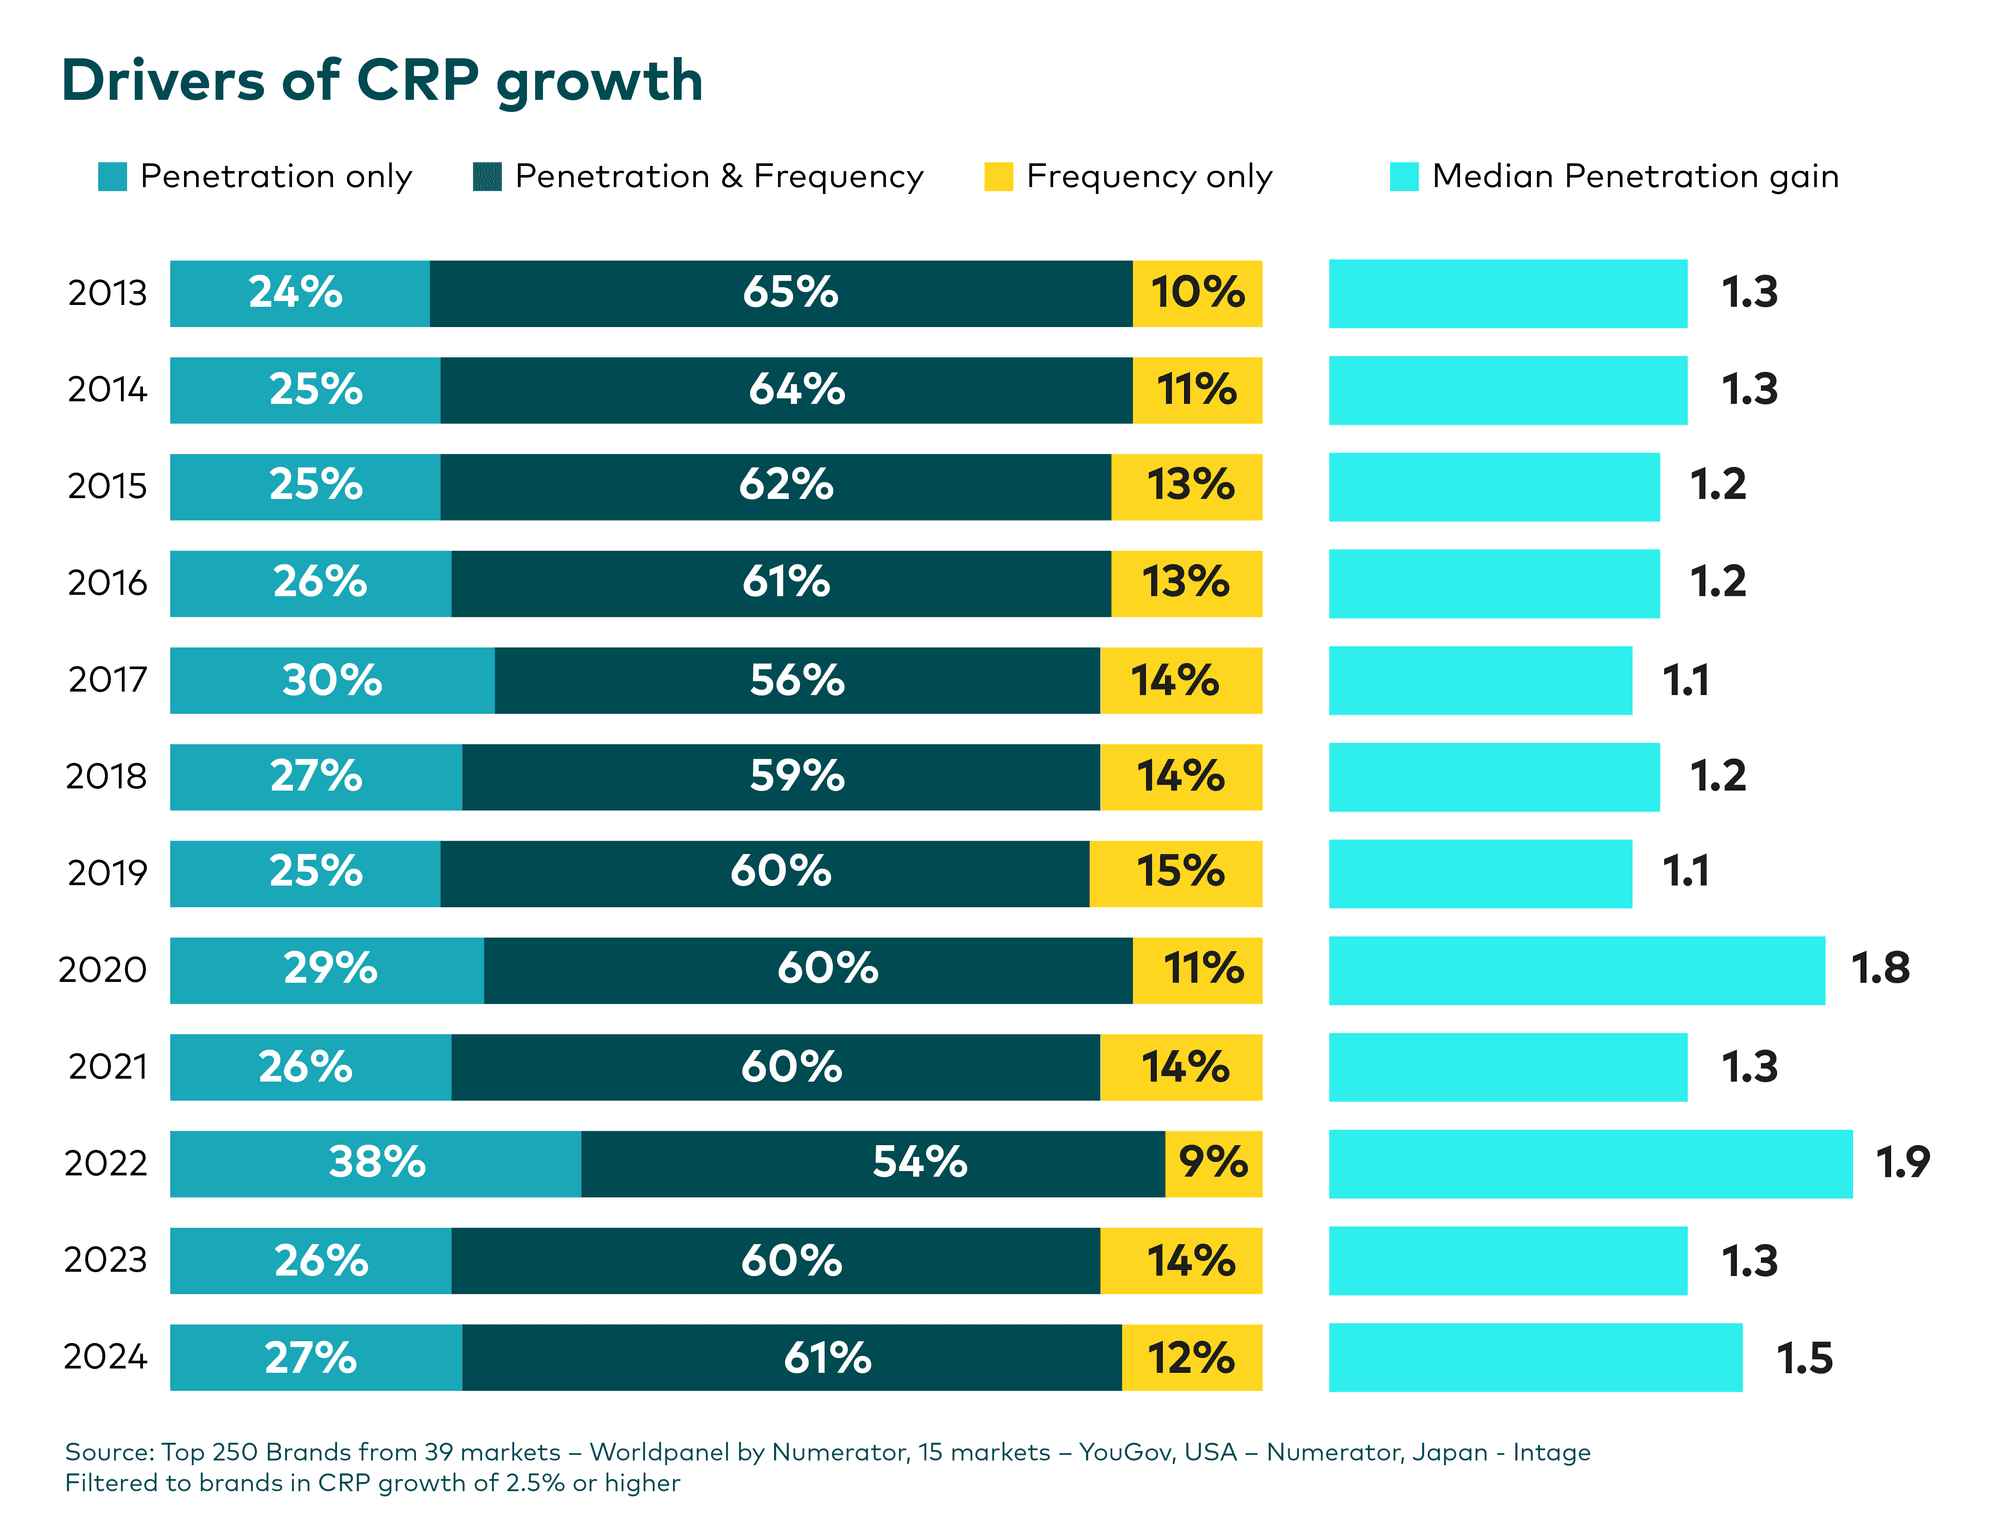
Moving from likelihood to certainty, our analysis of successful brands reveals one near-universal truth: growing your shopper base guarantees growth. Just as the 50:50 split has remained constant across the lifetime of Brand Footprint, so have the mechanics of growth. Penetration is king: over the 13 years, 88% of growing brands increased their number of shoppers.
While the specific mechanisms of growth have shown slight variations over time, this fundamental requirement has remained remarkably consistent.
The 2022 inflation spike created a more noticeable shift, with significantly more brands achieving growth through penetration gains alone, highlighting how external economic pressures can alter the growth dynamics.
Should prices rise again in the next 12 months, we may witness a similar pattern, with penetration emerging as even more critical as consumers become price-sensitive and brands compete more aggressively for share.
While the drivers of growth have remained remarkably consistent over time, the level of penetration change required to expand a brand’s footprint has shifted considerably. From 2013 to 2019, growing brands averaged 1.2 penetration points gained. Over the past five years, this average has increased to 1.6 penetration points, suggesting that while the building blocks of growth stay the same, the bar for meaningful growth has risen permanently.
Understanding this change is crucial for setting realistic targets and benchmarking performance expectations.
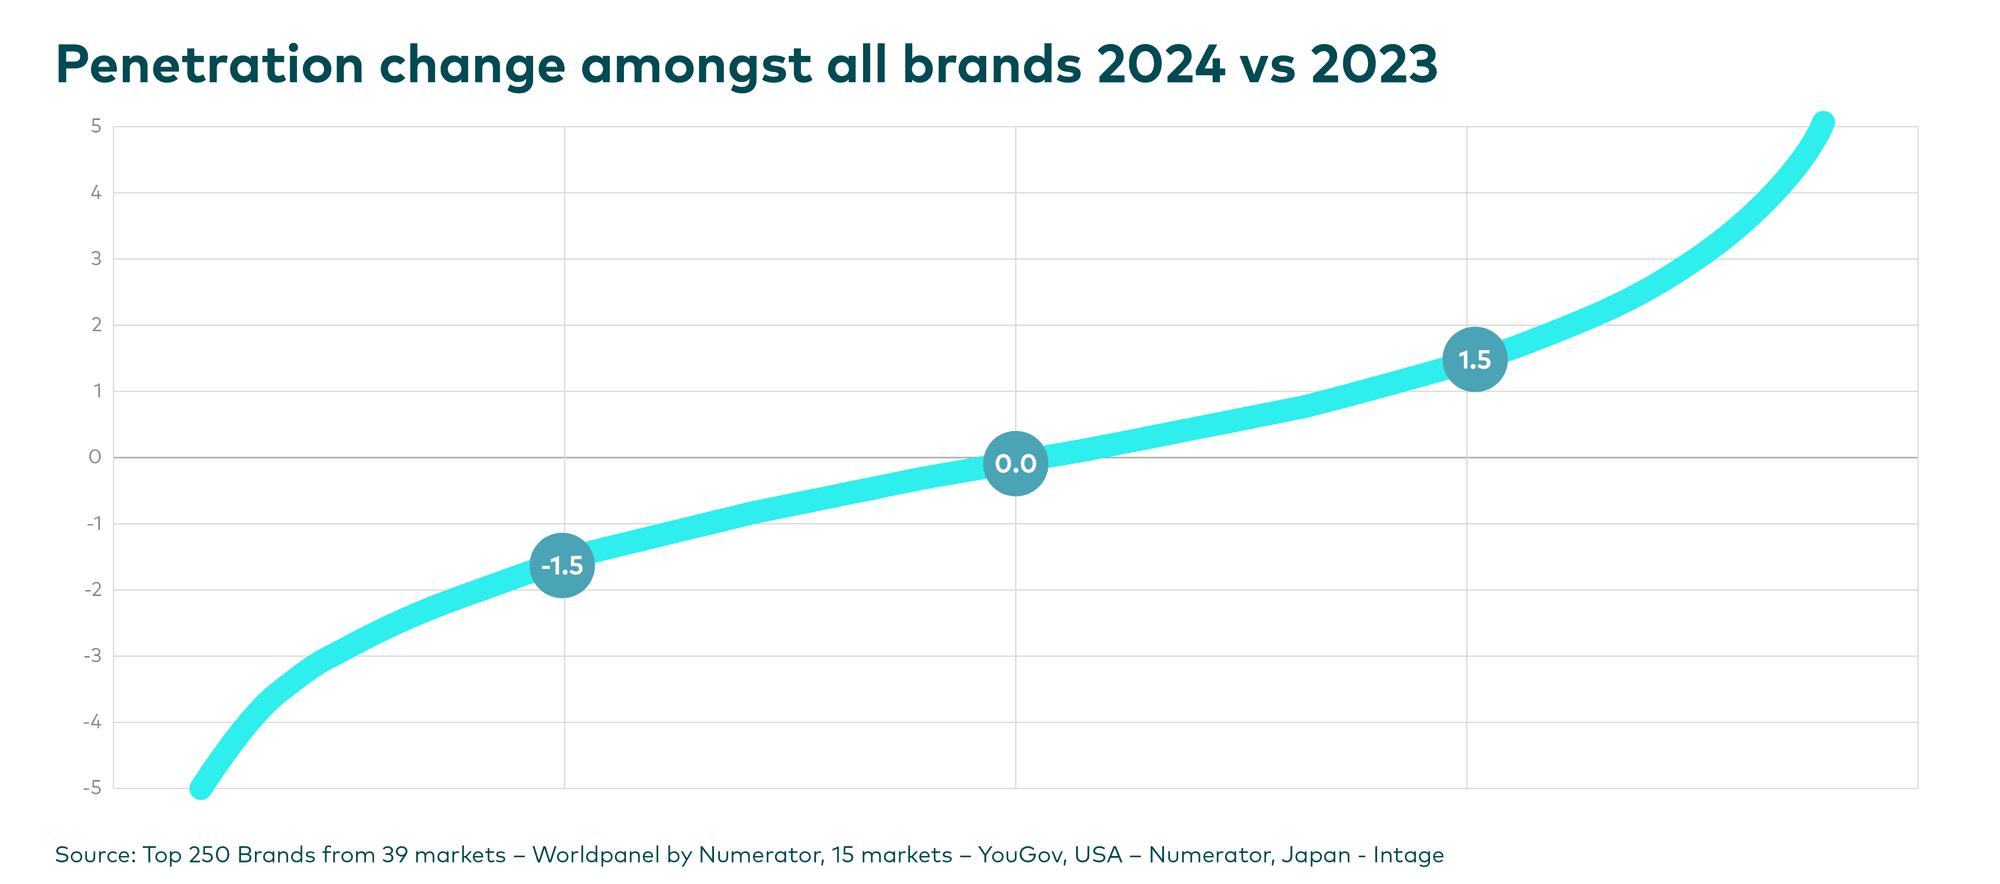
The penetration game mirrors the broader 50:50 dynamic: exactly half of all brands achieve penetration growth in any given year.
The median penetration gain in 2024 was 1.5%, meaning that achieving this level placed brands in the top 25% of performers globally. As a pragmatic benchmark, we recommend setting a target penetration gain of 1%, which would still position your brand in the top third of global performers.
Success requires understanding how all factors interact. As we have shown, your growth probability depends on your current brand size, existing momentum, proposed pricing strategy, and the market dynamics in your region. Brands that systematically address each factor can shift the fundamental 50:50 odds substantially in their favour.
Looking ahead, the brands that consistently win the 50:50 game will be those that treat growth not as a matter of chance, but as a strategic discipline built on consistent application of proven principles.
Two top performers in particular were entirely in command of these principles in 2024: Lay’s and OMO. Both gained over 20 million shoppers each; the kind of systematic acquisition that would make any brand envious, and precisely what winning the 50:50 game is about.
Which other brands conquered the global penetration battle? The next chapter showcases the Top 50 most chosen brands in the world – revealing the winners of the 50:50 game.